Workflow
There are a variety of ways to run evaluations that range from interactive work in a notebook or REPL all the way up to running large evaluation suites. We’ll start with the basics, then cover exploratory workflows, and finally discuss how to compose evals together into a suite.
Eval Basics
To create an evaluation, write a function that returns a Task. This task will bring together the dataset, solvers, scorer, and configuration required for the evaluation. Here’s the example used in the introduction:
from inspect_ai import Task, task
from inspect_ai.dataset import example_dataset
from inspect_ai.scorer import model_graded_fact
from inspect_ai.solver import (
  chain_of_thought, generate, self_critique
)

@task
def theory_of_mind():
    return Task(
        dataset=example_dataset("theory_of_mind"),
        plan=[
          chain_of_thought(),
          generate(),
          self_critique()
        ],
        scorer=model_graded_fact(),
    )
We walked through this code in detail in Hello, Inspect so won’t do so again here (you may want to refer back to that section now if this code isn’t familiar to you).
Running
You can run this evaluation from the shell using the inspect eval command. For example:
$ inspect eval theory.py --model openai/gpt-4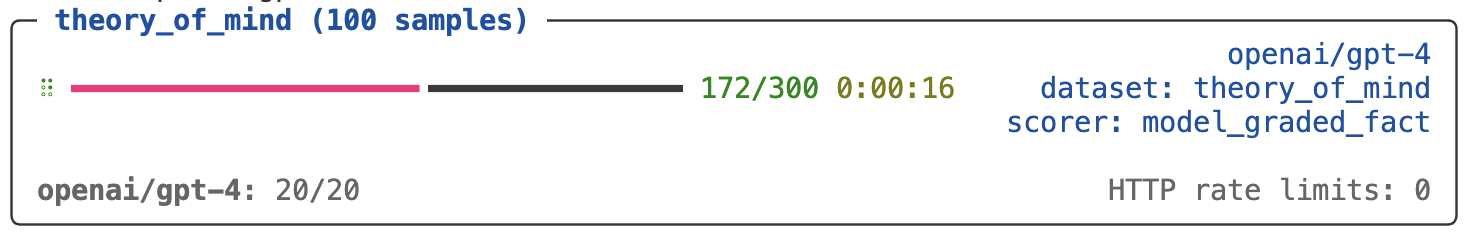
Immediately after an evaluation completes, a link to the log for the evaluation is written to the terminal.
If you are using VS Code, we also recommend installing the VS Code Extension, which includes tools for running, tuning, debugging, and visualising evals. See the article on the VS Code Extension for more details on installing and using the extension.
Models
Run the evaluation against other models as follows:
$ inspect eval theory.py --model anthropic/claude-3-opus-20240229
$ inspect eval theory.py --model mistral/mistral-large-latest
$ inspect eval theory.py --model hf/meta-llama/Llama-2-7b-chat-hf
Most often you’ll work with one model at a time. In this case, setting the INSPECT_EVAL_MODEL environment variable might make sense:
$ export INSPECT_EVAL_MODEL=google/gemini-1.0-pro
$ inspect eval theory.py
Visualising
As you iterate on an evaluation, you’ll typically want to dig further into message histories, scoring decisions, and other diagnostics. Typically at the outset of working session you’ll run inspect view to open the Inspect Log Viewer:
$ inspect view
The log viewer will update automatically whenever a new evaluation is completed (you can also navigate back to previous evaluations). The log viewer summarises aggregate data and also provides a detailed view into each sample. For example, here we zoom in on the model’s scoring explanation for a specific sample:

See the Log Viewer section for additional details on using Inspect View.
Options
There are several other command line options you can pass to eval. Here are some of the more useful ones:
# limit to 10 samples
$ inspect eval theory.py --limit 10

# limit tokens
$ inspect eval theory.py --max-tokens 128

# set temperature and seed
$ inspect eval theory.py --temperature 0 --seed 42
Configuration
As you can see, there is often a lot of configuration required for calling inspect eval. While we can include it all on the command line, it’s generally easier to use environment variables. To facilitate this, the inspect CLI will automatically read and process .env files located in both the working directory and the directory where the task source file is located (this is done using the python-dotenv package).
For example, here’s a .env file that makes available API keys for several providers and sets a bunch of defaults for a working session:
OPENAI_API_KEY=your-api-key
ANTHROPIC_API_KEY=your-api-key
GOOGLE_API_KEY=your-api-key

INSPECT_LOG_DIR=./logs-04-07-2024
INSPECT_LOG_LEVEL=info

INSPECT_EVAL_MAX_RETRIES=10
INSPECT_EVAL_MAX_CONNECTIONS=20
INSPECT_EVAL_MODEL=anthropic/claude-3-opus-20240229
All command line options can also be set via environment variable by using the INSPECT_EVAL_ prefix. See inspect eval –-help for documentation on all available options.
Note that .env files are searched for in parent directories, so if you run an Inspect command from a subdirectory of a parent that has an .env file, it will still be read and resolved. If you define a relative path to INSPECT_LOG_DIR in a .env file, then its location will always be resolved as relative to that .env file (rather than relative to whatever your current working directory is when you run inspect eval).
.env files should never be checked into version control, as they nearly always contain either secret API keys or machine specific paths. A best practice is often to check in an .env.example file to version control which provides an outline (e.g. keys only not values) of variables that are required by the current project.
Exploratory
Evaluation development is often highly exploratory and requires trying (and measuring) many combinations of components. You’ll often want to start in a notebook or REPL to facilitate this.
For exploratory work, you’ll still write a @task function, but you’ll give it arguments that reflect the things you want to try out and vary. You’ll then call Inspect’s eval() function interactively rather than calling inspect eval from the shell.
Note that the code below demonstrates exploratory workflows, but unlike the code above isn’t intended for direct execution but rather only for illustration. For example, we call the plot_results() function which isn’t directly defined but rather just an example of a function you might call after running some eval tasks.
Task Args
To illustrate, we’ll use a very simple example: an evaluation that checks whether a model can provide good computer security advice. The eval uses a model to score the results, and we want to explore how different system prompts, grader instructions, and grader models affect the quality of the eval.
To do this, we add some arguments to our @task function. Here’s the basic setup for the evaluation:
from inspect_ai import Task, eval, task
from inspect_ai.dataset import json_dataset
from inspect_ai.scorer import model_graded_fact
from inspect_ai.solver import generate, system_message

from itertools import product

@task
def security_guide(
    system="devops.txt",
    grader="expert.txt",
    grader_model="openai/gpt-4"
):
   return Task(
      dataset=json_dataset("security_guide.jsonl"),
      plan=[system_message(system), generate()],
      scorer=model_graded_fact(
          template=grader, model=grader_model
      )
   )
The system and grader arguments point to files we are using as system message and grader model templates. At the outset we might want to explore every possible combination of these parameters. We can use the itertools.product function to do this:
# 'grid' will be a permutation of all parameters
params = {
    "system": ["devops.txt", "researcher.txt"],
    "grader": ["hacker.txt", "expert.txt"],
    "grader_model": ["openai/gpt-4", "google/gemini-1.0-pro"],
}
grid = list(product(*(params[name] for name in params)))

# run the evals and capture the logs
logs = eval(
    [
        security_guide(system, grader, grader_model)
        for system, grader, grader_model in grid
    ],
    model="mistral/mistral-large-latest",
)

# analyze the logs...
plot_results(logs)
Calling the eval() function interactively yields the same progress treatment and results display that you see when running inspect eval from the terminal. However, as demonstrated above, a list of EvalLog objects is also returned that enables you to compute on the results of the evaluation (do diagnostics, generate plots, etc.).
Note that if errors occur in one task, it won’t interrupt the entire call to eval(). Rather, an EvalLog with a status of "error" will be returned. So a more realistic code snippet for handling the result of eval() might be something like this:
plot_results([log for log in logs if log.status == "success"])You might additionally choose to print error messages for failed tasks, or perhaps even abandon plotting altogether if all of the evals don’t succeed.
See Eval Logs for additional details on working with evaluation logs.
Transition
Ideally we could have a nice transition between the parameterized task functions created in exploratory mode and the more static eval definitions used for inspect eval. We can actually do this fairly easily by letting Python know that certain parts of our script (the exploratory code) should not be run when it is read as a module by inspect eval.
Returning to the example above, let’s say that after experimenting, we were comfortable with our grader, and are now only iterating on the system prompt:
@task
def security_guide(system="devops.txt"):
   return Task(
      dataset=json_dataset("security_guide.jsonl"),
      plan=[system_message(system), generate()],
      scorer=model_graded_fact(
          template="expert.txt", model="openai/gpt-4"
      )
   )

# vary the system prompt
tasks = [
    security_guide(system=prompt)
    for prompt in ["devops.txt", "researcher.txt"]
]
eval(tasks, model = "openai/gpt-4")
If we enclose the exploratory code at the bottom in a __name__ == "__main__" conditional, then it will only be run when interactively executing the script or notebook cell that the code is contained in:
if __name__ == "__main__":
    # vary the system prompt
    tasks = [
        security_guide(system=prompt)
        for prompt in ["devops.txt", "researcher.txt"]
    ]
eval(tasks, model = "openai/gpt-4")Now we can take the same script and use it with inspect eval (while leaving our exploratory code intact and protected by the __main__ check):
$ inspect eval security.py We can even continue to use task parameters with inspect eval as follows:
$ inspect eval security.py -T system=devops.txtNotebooks
We refer to notebooks above but show scripts in all of the examples. Everything demonstrated for scripts will work similarly in notebooks, specifically:
You can use the
__name__ == "__main__"check to protect cells that should only be run in exploratory mode.You can pass a notebook to
inspect evaljust the same as a script (including passing task parameters)
For example, imagine that all of the code shown above for security.py was in security.ipynb. You could run the eval and optionally pass a task parameter as follows:
$ inspect eval security.ipynb
$ inspect eval security.ipynb -T system=devops.txt
Once you’ve stabilized the definition of an eval, you might also prefer to keep exploratory code and eval task definitions entirely separate. In that case, keep your @task function in security.py and then just import it into one or more notebooks used to try out variations, analyze logs, etc.
Eval Suites
The examples above either run a single evaluation task from a script or notebook, or perhaps run a dynamic set of tasks within an interactive session. While this is a good workflow for the development of evaluations, eventually you may want to compose a set of evaluations into a suite that you run repeatedly for different models.
For example, the left/right listing below shows a project with multiple Python scripts, some of which include eval tasks. At right, there is a call to inspect list tasks to enumerate all the tasks:
security/
  jeopardy/
    import.py
    analyze.py
    task.py
  attack_defense/
    import.py
    analyze.py
    task.py
$ inspect list tasks
jeopardy/task.py@crypto
jeopardy/task.py@decompile
jeopardy/task.py@packet
jeopardy/task.py@heap_trouble
attack_defense/task.py@saar
attack_defense/task.py@bank
attack_defense/task.py@voting
attack_defense/task.py@dnsHere are a few ways you could run these evals as a suite:
$ inspect eval security
$ inspect eval security/jeopardy
$ inspect eval security/attack_defense
Inspect has lots of features aimed at running evaluation suites, including filtering tasks based on tags/metadata, recovering from partially completed suites (due to failed evals), and more. See the documentation on Eval Suites to learn more.