Eval Logs
Overview
Every time you use inspect eval or call the eval() function, an evaluation log is written for each task evaluated. By default, logs are written to the ./logs sub-directory of the current working directory (we’ll cover how to change this below). You will find a link to the log at the bottom of the results for each task:
$ inspect eval security_guide.py --model openai/gpt-4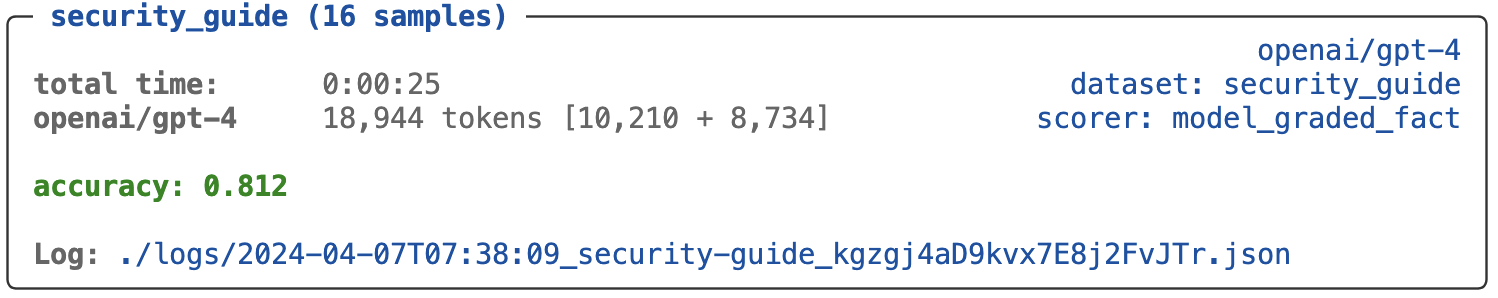
You can also use the Inspect log viewer for interactive exploration of logs. Run this command once at the beginning of a working session (the view will update automatically when new evaluations are run):
$ inspect view
This section won’t cover using inspect view though. Rather, it will cover the details of managing log usage from the CLI as well as the Python API for reading logs. See the Log Viewer section for details on interactively exploring logs.
Log Location
By default, logs are written to the ./logs sub-directory of the current working directory You can change where logs are written using eval options or an environment variable:
$ inspect eval popularity.py --model openai/gpt-4 --log-dir ./experiment-logOr:
log = eval(popularity, model="openai/gpt-4", log_dir = "./experiment-log")Note that in addition to logging the eval() function also returns an EvalLog object for programmatic access to the details of the evaluation. We’ll talk more about how to use this object below.
The INSPECT_LOG_DIR environment variable can also be specified to override the default ./logs location. You may find it convenient to define this in a .env file from the location where you run your evals:
INSPECT_LOG_DIR=./experiment-log
INSPECT_LOG_LEVEL=warning
If you define a relative path to INSPECT_LOG_DIR in a .env file, then its location will always be resolved as relative to that .env file (rather than relative to whatever your current working directory is when you run inspect eval).
If you are running in VS Code, then you should restart terminals and notebooks using Inspect when you change the INSPECT_LOG_DIR in a .env file. This is because the VS Code Python extension also reads variables from .env files, and your updated INSPECT_LOG_DIR won’t be re-read by VS Code until after a restart.
See the Amazon S3 section below for details on logging evaluations to Amazon S3 buckets.
EvalLog
The EvalLog object returned from eval() provides programmatic interface to the contents of log files:
Class inspect_ai.log.EvalLog
| Field | Type | Description |
|---|---|---|
status |
str |
Status of evaluation ("started", "success", or "error"). |
eval |
EvalSpec |
Top level eval details including task, model, creation time, etc. |
plan |
EvalPlan |
List of solvers and model generation config used for the eval. |
samples |
list[EvalSample] |
Each sample evaluated, including its input, output, target, and score. |
results |
EvalResults |
Aggregate results computed by scorer metrics. |
stats |
EvalStats |
Model usage statistics (input and output tokens) |
logging |
list[LoggingMessage] |
Logging messages (e.g. from log.info(), log.debug(), etc. |
error |
EvalError |
Error information (if status == "error) including traceback. |
Before analysing results from a log, you should always check their status to ensure they represent a successful run:
log = log = eval(popularity, model="openai/gpt-4")
if log.status == "success":
   ...
In the section below we’ll talk more about how to deal with logs from failed evaluations (e.g. retrying the eval).
You can enumerate, read, and write EvalLog objects using the following helper functions from the inspect_ai.log module:
| Function | Description |
|---|---|
list_eval_logs() |
List all of the eval logs at a given location. |
read_eval_log(log_file) |
Read an EvalLog from a log file path. |
write_eval_log(log, log_file) |
Write an EvalLog to a log file path. |
A common workflow is to define an INSPECT_LOG_DIR for running a set of evaluations, then calling list_eval_logs() to analyse the results when all the work is done:
# setup log dir context
os.environ["INSPECT_LOG_DIR"] = "./experiment-logs"

# do a bunch of evals
eval(popularity, model="openai/gpt-4")
eval(security_guide, model="openai/gpt-4")

# analyze the results in the logs
logs = list_eval_logs()
Note that list_eval_logs() lists log files recursively. Pass recursive=False to list only the log files at the root level.
Errors and Retries
When an evaluation task fails due to an error or is otherwise interrupted (e.g. by a Ctrl+C), an evaluation log is still written. In many cases errors are transient (e.g. due to network connectivity or a rate limit) and can be subsequently retried.
For these cases, Inspect includes an eval-retry command and eval_retry() function that you can use to resume tasks interrupted by errors (including preserving samples already completed within the original task). For example, if you had a failing task with log file logs/2024-05-29T12-38-43_math_Gprr29Mv.json, you could retry it from the shell with:
$ inspect eval-retry logs/2024-05-29T12-38-43_math_43_math_Gprr29Mv.jsonOr from Python with:
eval_retry("logs/2024-05-29T12-38-43_math_43_math_Gprr29Mv.json")Note that eval_retry() does not overwrite the previous log file, but rather creates a new one (preserving the task_id from the original file).
Here’s an example of retrying a failed eval with a lower number of max_connections (the theory being that too many concurrent connections may have caused a rate limit error):
log = eval(my_task)[0]
if log.status != "success":
  eval_retry(log, max_connections = 3)
Sample Preservation
When retrying a log file, Inspect will attempt to re-use completed samples from the original task. This can result in substantial time and cost savings compared to starting over from the beginning.
IDs and Shuffling
An important constraint on the ability to re-use completed samples is matching them up correctly with samples in the new task. To do this, Inspect requires stable unique identifiers for each sample. This can be achieved in 1 of 2 ways:
Samples can have an explicit
idfield which contains the unique identifier; orYou can rely on Inspect’s assignment of an auto-incrementing
idfor samples, however this will not work correctly if your dataset is shuffled. Inspect will log a warning and not re-use samples if it detects that thedataset.shuffle()method was called, however if you are shuffling by some other means this automatic safeguard won’t be applied.
If dataset shuffling is important to your evaluation and you want to preserve samples for retried tasks, then you should include an explicit id field in your dataset.
Max Samples
Another consideration is max_samples, which is the maximum number of samples to run concurrently within a task. Larger numbers of concurrent samples will result in higher throughput, but will also result in completed samples being written less frequently to the log file, and consequently less total recovable samples in the case of an interrupted task.
By default, Inspect sets the value of max_samples to max_connections + 1, ensuring that the model API is always fully saturated (note that it would rarely make sense to set it lower than max_connections). The default max_connections is 10, which will typically result in samples being written to the log frequently. On the other hand, setting a very large max_connections (e.g. 100 max_connections for a dataset with 100 samples) may result in very few recoverable samples in the case of an interruption.
Note also that when using Tool Environments, the tool environment provider may place an additional cap on the default max_samples (for example, the Docker provider limits the default max_samples to no more than 25).
We’ve discussed how to manage retries for a single evaluation run interactively. For the case of running many evaluation tasks in batch and retrying those which failed, see the documentation on retrying tasks within Eval Suites
Amazon S3
Storing evaluation logs on S3 provides a more permanent and secure store than using the local filesystem. While the inspect eval command has a --log-dir argument which accepts an S3 URL, the most convenient means of directing inspect to an S3 bucket is to add the INSPECT_LOG_DIR environment variable to the .env file (potentially alongside your S3 credentials). For example:
INSPECT_LOG_DIR=s3://my-s3-inspect-log-bucket
AWS_ACCESS_KEY_ID=AKIAIOSFODNN7EXAMPLE
AWS_SECRET_ACCESS_KEY=wJalrXUtnFEMI/K7MDENG/bPxRfiCYEXAMPLEKEY
AWS_DEFAULT_REGION=eu-west-2
One thing to keep in mind if you are storing logs on S3 is that they will no longer be easily viewable using a local text editor. You will likely want to configure a FUSE filesystem so you can easily browse the S3 logs locally.
Log CLI Commands
We’ve shown a number of Python functions that let you work with eval logs from code. However, you may be writing an orchestration or visualisation tool in another language (e.g. TypeScript) where its not particularly convenient to call the Python API. The Inspect CLI has a few commands intended to make it easier to work with Inspect logs from other languages.
Listing Logs
You can use the inspect list logs command to enumerate all of the logs for a given log directory. This command will utilise the INSPECT_LOG_DIR if it is set (alternatively you can specify a --log-dir directly). You’ll likely also want to use the --json flag to get more granular and structured information on the log files. For example:
$ inspect list logs --json           # uses INSPECT_LOG_DIR
$ inspect list logs --json --log-dir ./security_04-07-2024
You can also use the --status option to list only logs with a success or error status:
$ inspect list logs --json --status success
$ inspect list logs --json --status error
You can use the --retryable option to list only logs that are retryable
$ inspect list logs --json --retryableReading Logs
The inspect list logs command will return set of URIs to log files which will use a variety of protocols (e.g. file://, s3://, gcs://, etc.). You might be tempted to try to read these URIs directly, however you should always do so using the inspect info log-file command. This is because log files can be located on remote storage systems (e.g. Amazon S3) that users have configured read/write credentials for within their Inspect environment, and you’ll want to be sure to take advantage of these credentials.
For example, here we read a local log file and a log file on Amazon S3:
$ inspect info log-file file:///home/user/log/logfile.json
$ inspect info log-file s3://my-evals-bucket/logfile.json
Log files are stored in JSON. You can get the JSON schema and TypeScript type definitions for the log file format with the following calls to inspect info:
$ inspect info log-schema
$ inspect info log-typesBecause evaluation logs contain lots of numerical data and calculations, it is possible that some number values will be NaN or Inf. These numeric values are supported natively by Python’s JSON parser, however are not supported by the JSON parsers built in to browsers and Node JS.
To correctly read Nan and Inf values from eval logs in JavaScript, we recommend that you use the JSON5 Parser. For other languages, Nan and Inf may be natively supported (if not, see these JSON 5 implementations for other languages).