ZeroBench
A lightweight visual reasoning benchmark that is (1) Challenging, (2) Lightweight, (3) Diverse, and (4) High-quality.
Overview
ZeroBench is a benchmark designed to evaluate the visual reasoning of multimodal language models. It features a collection of challenging, domain-agnostic reasoning questions that require models to extract and process information directly from provided images to formulate correct answers. The benchmarks consists of two splits consisting of 100 challenging questions and 334 sub-questions.
This benchmark has two differentiating factors from other visual reasoning benchmarks:
- It was intentionally made to be challenging so that it can benchmark future models. At the writing of the paper, none of the commercial LLMs were able to get a single question right.
- Lightweight, consisting of only 100 questions, which makes it cheaper to run evaluations.
New models have been evaluated since release. More information and updates can be found at the ZeroBench website.
Useage
To run this benchmark with the default hyperparameters, use the following bash command:
inspect eval inspect_evals/zerobench --model MODEL_NAME --max-tokens 16000 --temperature 0.7 --top-p 0.95

inspect eval inspect_evals/zerobench_subquestions --model MODEL_NAME --max-tokens 16000 --temperature 0.7 --top-p 0.95
To hide the individual subquestion group results and only report overall scores, use the verbose parameter:
inspect eval inspect_evals/zerobench_subquestions --model MODEL_NAME -T verbose=FalseReplace MODEL_NAME with the name of the model you want to evaluate.
Some experimental configurations are defaulted; they are shown through the environmental variables defined at the beginning of the document. MAX_RETRIES is set to 0, SEED is set to 42. These can be overridden by using the flags –max-retries and –seed, respectively. K - the number of repeated sampling per question - is 5 and TOP_N - the number of responses sampled to estimate the accuracy through pass@k calculations - is {1, 5}. Arguments to the zerobench evaluation can be inputed with the -T flag. For example
inspect eval --model MODEL_NAME -T "k={1, 3}"Python versions
This benchmark was implemented using Python 3.11. As of 2025, we don’t anticipate any specific Python version compatibility issues with this benchmark as all the questions and images are readily available on Hugging Face.
Maintenance notes
Updates to the ZeroBench dataset should not break the code, given that the dataset schema and scoring method doesn’t get changed.
Dataset
Each subtask has its own types of questions and the answers are compared against a ground truth (except for Coding and Instruction Following).
Question: “I want to purchase all the Montellier bottles from the top three shelves. How much do I save by purchasing the bottles with a loyalty card? Give your final answer in dollars.
Let’s think step by step and give the final answer in curly braces, like this: {final answer}”
(Ground Truth: “11.90”)
And below is an example from the easier sub-questions from the sample image:
Question: “What is the original price per Montellier bottle without the discount?”
(Ground Truth: “1.59”)
Development details
ZeroBench was developed through a process of human curation:
Generate initial questions: The examples were made by one of 20 human creators with the following instructions:
- Include a difficult visual component essential to answering the question.
- Include multi-step reasoning.
- Be as challenging as possible.
This generated a pool of 140 candidate questions that were then filtered down through an initial evaluation and review.
- Include a difficult visual component essential to answering the question.
Process of filtering and refining: The initial pool of 140 candidate questions was reduced to the final set of 100 challenging questions through a process of feedback, initial evaluation, thorough review, and adversarial filtering.
Deriving subquestions: To differentiate between model performance, subquestions were generated from every main question. These were derived from explicit question subparts, natural reasoning steps, or other quantities relevant to deriving the final answer.
Scoring
Model responses were evaluated by parsing the text enclosed within curly braces {}. Correctness was determined via exact matching against the ground truth, resulting in a binary (correct/incorrect) metric, even for numerical answers.
ZeroBench employs a comprehensive set of metrics to assess model performance, including Accuracy, Pass@K, K/K Reliability, and Mean Accuracy on Sub-questions.
Accuracy
The number of samples correct / total number of questions in the benchmark. For models that failed to adhere to the specified output format, Gemini 2 Flash was utilized for an initial parsing attempt before comparison. Responses that exceeded the maximum token length or resulted in no completion tokens from API services were automatically marked as incorrect.
Pass@K and K/K Reliability
These metrics involve generating multiple (n) responses from a model and then sampling a subset (k) from them. Pass@K: A question is considered correct if any of the k sampled responses are accurate. We measure the probability of a sample being correct. K/K Reliability: A question is considered correct only if all of the k sampled responses are accurate. We measure the probability of a sample being correct.
Mean Accuracy on Sub-questions: (Only used for the Zerobench_subquestions split)
Each sample in the sub-question dataset is related to a main question from the main split. Following the original paper the accuracy of the sub-questions grouped by the main question is calculated. Then the mean average was caclulated. This metric is named mean_accuracy_groupedby_main_questionID in the evaluation. The standard error of these means are also calculated. This metric is named all_samples_mean_stderr in the evaluation.

For further details, see ZeroBench in Inspect Metrics Visualised in the appendix of this file.
Evaluation results using the ZeroBench dataset (100 samples 2025-05-30)
As per the benchmark leaderboad, pass@1 and n correct are based on 1 sampling carried out using greedy decoding (temperature=0) where possible, otherwise default parameters are used. pass@5 and 5/5 reliability are based on 5 samplings at temperature=0.7 and top_p=0.95.
| Model | Additional hyperparameters | k/k (k=5) | pass@k (k=1) | pass@k (k=5) |
|---|---|---|---|---|
| gpt-4o-2024-11-20 | –max-tokens 16000. Greedy decoding was used for pass@1 and params above for pass@5. | 0 | 0 | 0.01 |
| gpt-4o-mini-2024-07-18 | –max-tokens 16000. Greedy decoding was used for pass@1 and params above for pass@5. | 0 | 0 | 0.01 |
| o1-2024-12-17 | o series models do not support temperature, seed, or top_p. Set parameters include: –max-tokens 100000 | 0 | 0.01 | N.A |
| o1-mini-2024-09-12 | o series models do not support temperature, seed or top_p. Unknown max-tokens, thus, they were set as the default 16000 | 0 | 0 | 0 |
Evaluation results using the subquestions dataset (334 samples 2025-05-30)
| Model | Additional hyperparameters | k/k (k=5) | pass@k (k=1) | pass@k (k=5) | Mean accuracy on the subquestions (k=1) | Standard Error on Mean Accuracy |
|---|---|---|---|---|---|---|
| gpt-4o-mini-2024-07-18 | –max-tokens 16000 Greedy decoding was used for pass@1 and params above for pass@5 | 0.0928 | 0.165 | 0.263 | 0.245 | 0.024 |
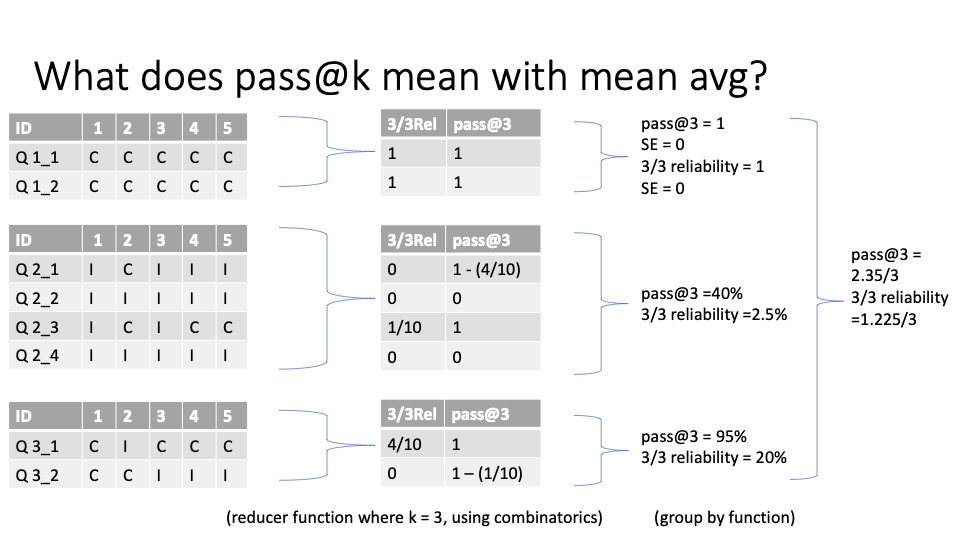
Appendix 1: Further details on how the reducer, groupby, and metric components interact for the Sub-Questions Dataset
The final accuracy metric is calculated in 4 steps:
Scoring: On the left hand column, we have the outputs of the scorer for each sample with the ID formatted as {main question number}_{subquestion number}. Multiple answers are generated for each sample, as specified by the user through the epoch flag.
Reducer: In the second column, the reducer calculates the pass@k and k/k relability metric for each sample, colapsing the results of the multiple epochs into one metric per sample.
Group by: In the third column, the groupby function calculates the average pass@k and k/k reliability with respects to the main question.
Final metric: The final column then calculates the average of the average pass@k and k/k reliability for all the main question groupings.
Parameters
zerobench
k(int): (default:5)top_n(set[int]): (default:{1, 5})
zerobench_subquestions
k(int): (default:5)top_n(set[int]): (default:{1, 5})verbose(bool): (default:True)
Changelog
[2-A] - 2026-02-16
- Migrate version to new scheme. See #907.
[1.0.1] - 2025-12-18
- Adds backoff policy for functions that connect to huggingface servers.